How to Get Started with Power BI
Table of Contents
- Introduction
- Sign Up and Access Power BI
- Power BI Components
- Core Concepts
- Connect Your First Data Source
- Build Your First Report
- Key Skills to Learn
- Share and Publish
- Embedding Power BI
- List of Terms
- Useful Resources
- Conclusion
Introduction
Power BI is Microsoft's enterprise-grade business intelligence platform built on an in-memory semantic model. It is widely used in organizations that rely on Microsoft and Azure stacks for data modeling, reporting, and interactive dashboards. This guide will help you get started — from sign-up all the way to your first published report.
Sign Up and Access Power BI
- Power BI Desktop — Free to download; no account required. Download from powerbi.microsoft.com.
- Power BI Service (cloud) — Sign up with a work or school Microsoft account at app.powerbi.com. Personal Microsoft accounts have limited service access.
- Free vs Pro vs Premium:
- Free — personal use and exploration only.
- Pro — required to share and collaborate with colleagues ($10/user/month).
- Premium Per User (PPU) / Premium Capacity — higher refresh rates, larger datasets, paginated reports, and deployment pipelines.
Power BI Components
| Component | Description |
|---|---|
| Power BI Desktop | Windows application for building data models and reports |
| Power BI Service | Browser-based cloud platform for sharing and collaboration |
| Power BI Mobile | iOS / Android app for consuming dashboards on the go |
| Power BI Report Builder | Tool for designing pixel-perfect paginated reports |
| Power BI Gateway | Bridge for refreshing on-premises data in the cloud |
Core Concepts
Power BI is built around an in-memory semantic model — data is imported and compressed into memory for fast query performance, rather than querying the live source on every interaction.
- Semantic Model / Dataset — The underlying data model containing tables, relationships, and DAX measures.
- Report — The visual layer built on top of a dataset: charts, tables, maps, slicers, and more.
- Dashboard — A single-page canvas pinned from one or more reports (Service only).
- Workspace — A collaborative space in the Service for sharing datasets, reports, and dashboards across a team.
- Dataflow — A cloud-based ETL layer (Power Query in the Service) for reusable data transformations.
Connect Your First Data Source
Power BI Desktop supports 100+ built-in connectors. Steps to connect:
- Open Power BI Desktop → click Get Data on the Home ribbon.
- Choose a connector — for example, Excel, SQL Server, CSV, or Web.
- Enter connection details and credentials, then select the tables to load.
- Click Transform Data to open the Power Query Editor for cleaning and shaping before loading.
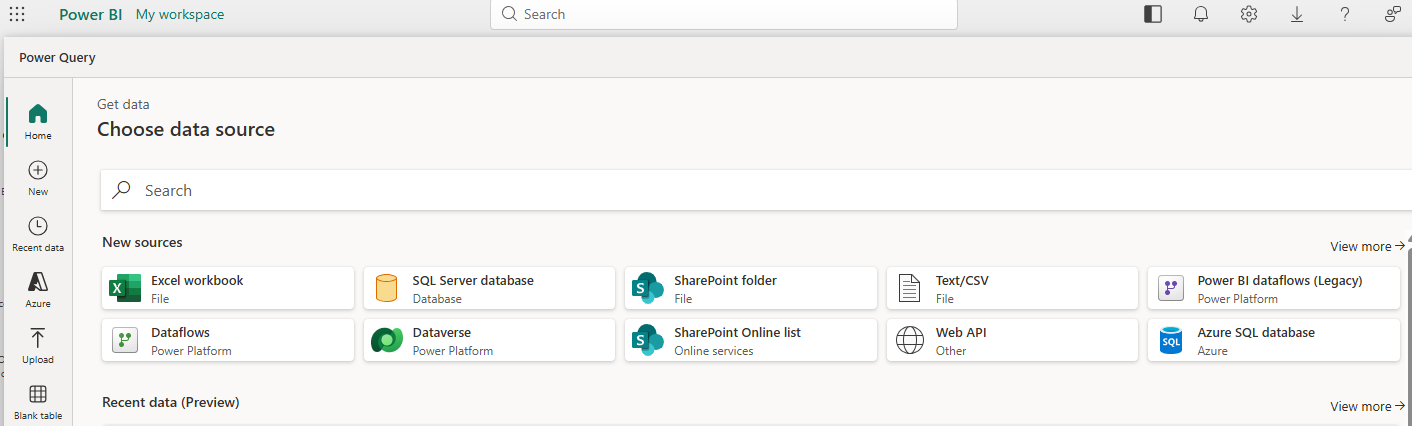 Step 1 — On the Home ribbon, click Get Data and choose a data source from the list.
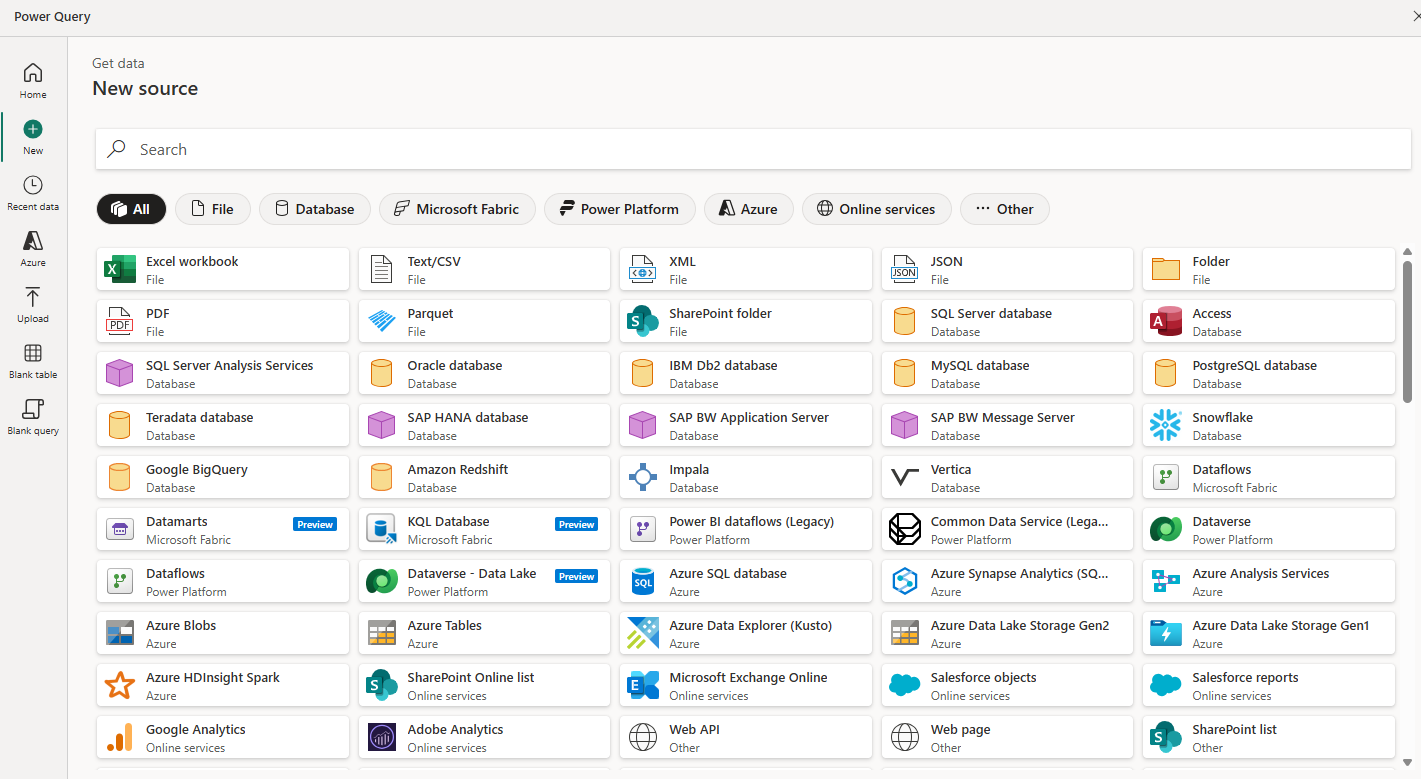 Step 2 — Click More… to browse the full connector list and find your specific data source.
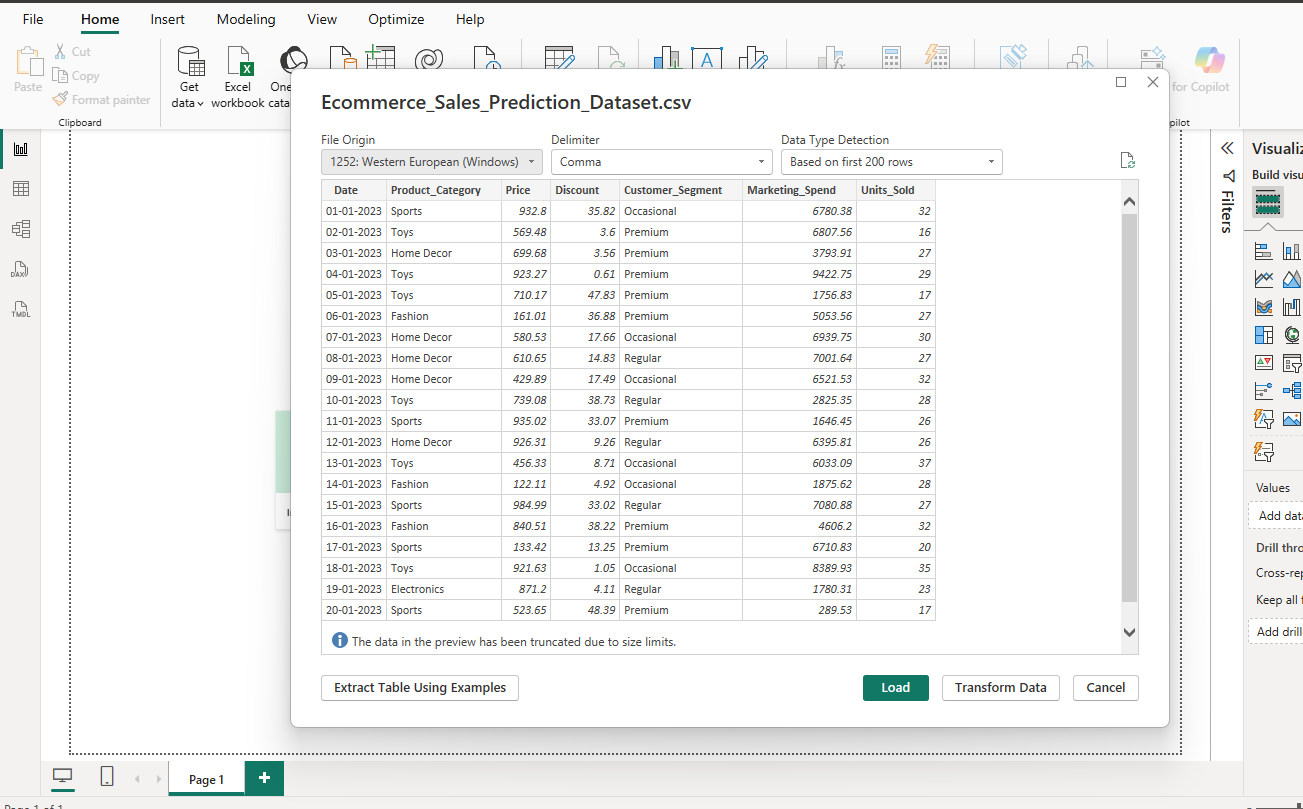 Step 3 — Select and load a sample CSV file to begin working with real data in the model.
Common data sources:
- Excel / CSV / JSON files
- SQL Server / Azure SQL / Azure Synapse
- SharePoint / OneDrive
- REST APIs (Web connector)
- Azure Data Lake Storage
- Dataverse / Dynamics 365
- Google BigQuery / Snowflake / Databricks (via connectors)
Build Your First Report
- After loading data, switch to Report view (canvas icon in the left sidebar).
- From the Fields pane (right side), drag a field onto the blank canvas to create a visual automatically.
- Use the Visualizations pane to switch chart types (bar chart, line chart, map, table, card, etc.).
- Add a Slicer visual to enable interactive date or category filtering.
- Use the Format pane (paintbrush icon) to adjust colors, labels, titles, and borders.
- Add multiple Pages (tabs at the bottom of the canvas) to organize content by topic or audience.
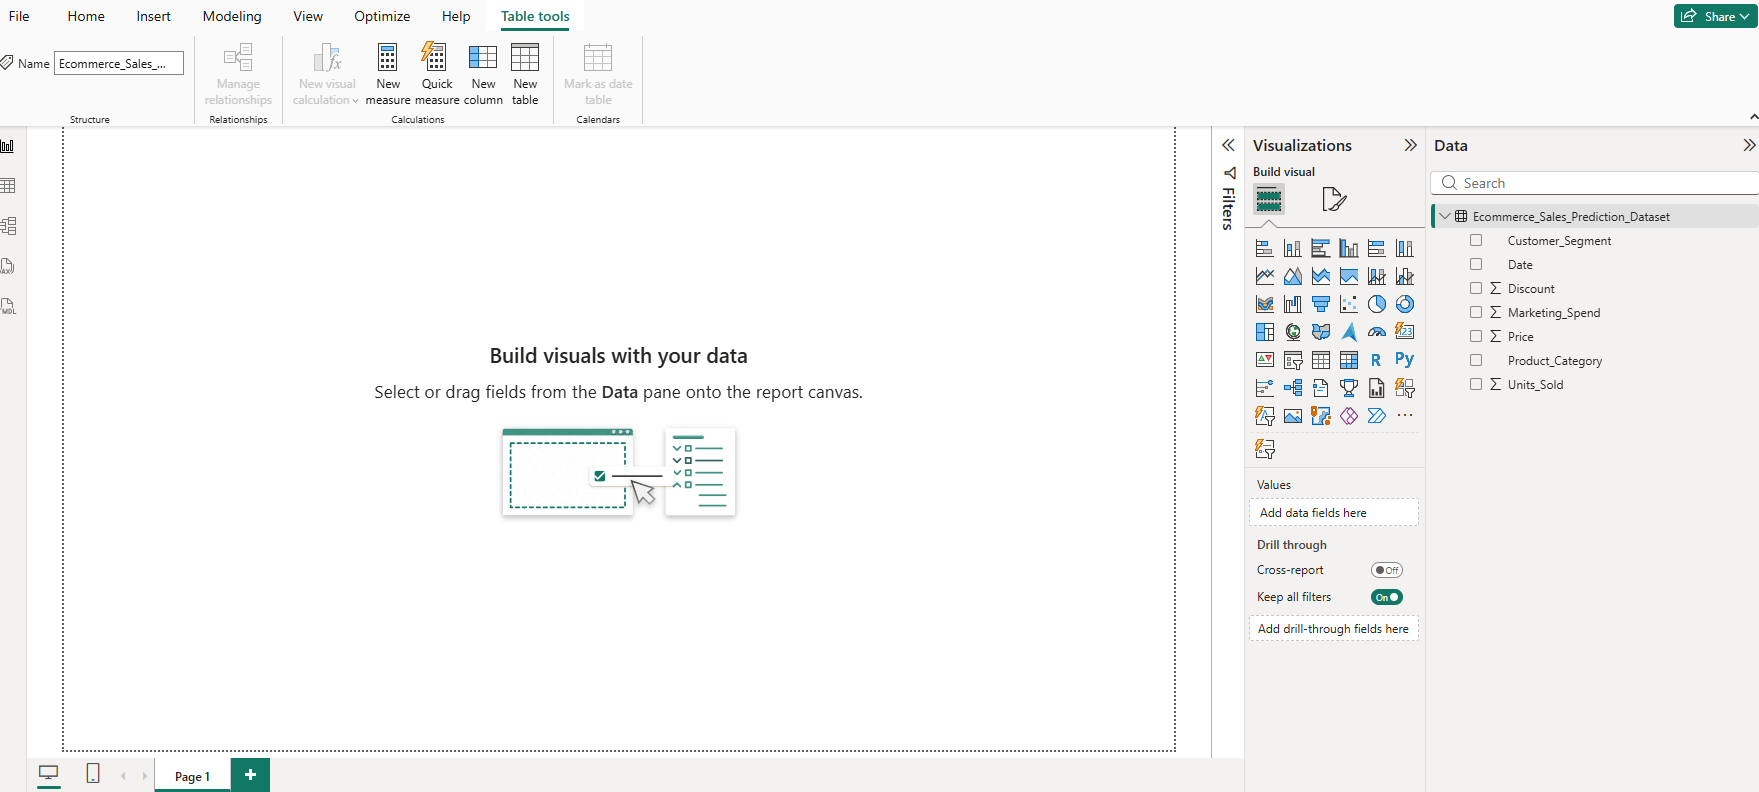 Step 4 — In Report view, drag fields from the Fields pane onto the canvas to create your first visual automatically.
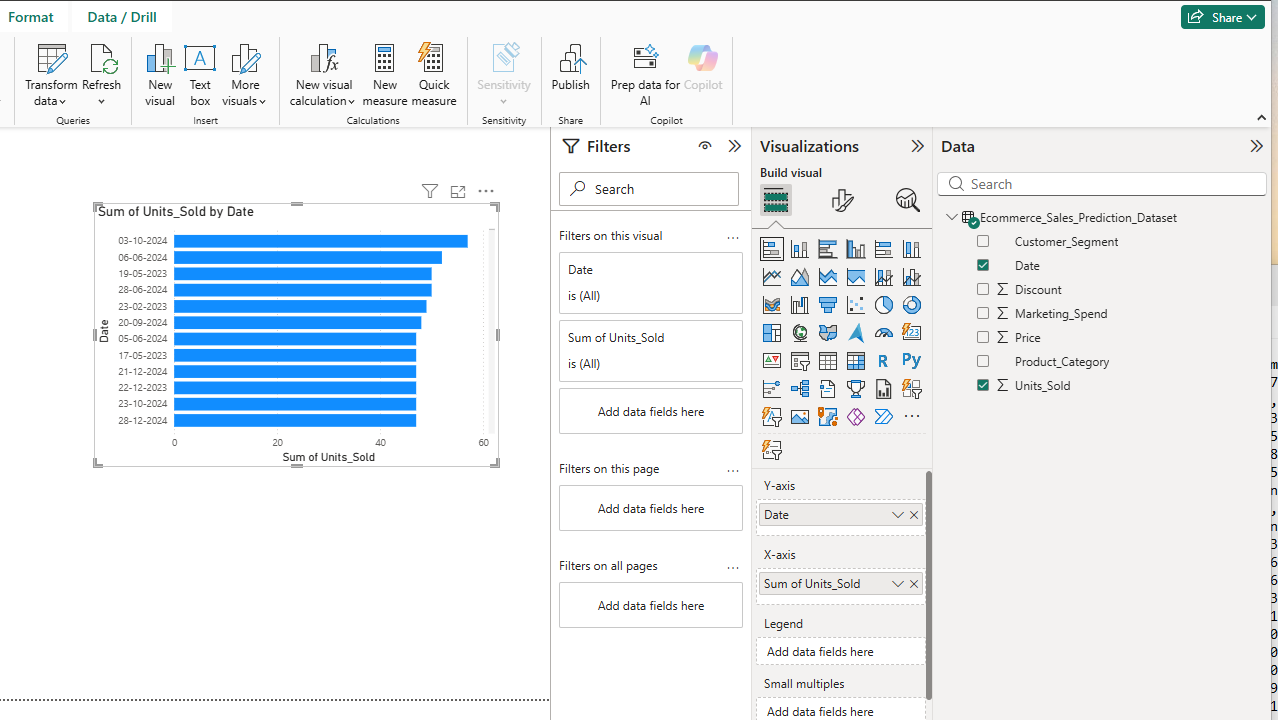 Step 5 — A completed simple report displaying total sales summed by date as a bar chart.
Key Skills to Learn
DAX (Data Analysis Expressions)
DAX is the formula language used to create calculated columns and measures in the semantic model.
- Similar in syntax to Excel formulas but designed for relational, columnar data.
- Measures are re-evaluated dynamically based on filter context.
- Essential functions to learn:
CALCULATE,SUM,SUMX,FILTER,ALL,RELATED,DIVIDE,DATEADD,TOTALYTD.
-- Simple measure
Total Sales = SUM(Sales[Amount])

-- Year-to-date measure
YTD Sales = TOTALYTD([Total Sales], 'Date'[Date])

-- Filtered measure
Sales USA = CALCULATE([Total Sales], Region[Country] = "USA")
Power Query / M Language
Power Query is the ETL layer — it runs before data enters the model.
- Low-code UI for most transformations (filter rows, remove duplicates, merge queries, unpivot columns).
- The underlying language is M (Power Query Formula Language).
- Common tasks: combining multiple files in a folder, splitting columns, changing data types, creating custom columns.
Share and Publish
- In Power BI Desktop, click Publish on the Home ribbon to upload to the Service.
- In the Service (app.powerbi.com), choose a Workspace to publish into.
- Share a report by clicking Share and entering colleague email addresses (Pro license required for recipients).
- Set up Scheduled Refresh in the dataset settings to keep imported data current (up to 8×/day on Pro, 48×/day on Premium).
- Bundle multiple reports into an App to give end users a clean, curated experience.
Embedding Power BI
Power BI offers several embedding options depending on your audience:
| Option | Audience | Auth |
|---|---|---|
| Publish to Web | Public internet | None (unauthenticated — do not use for sensitive data) |
| Embed for your organization | Internal portals | Azure Active Directory (AAD) |
| Power BI Embedded (Azure) | Customer-facing apps (ISV) | App-owns-data token |
| iFrame embed | Quick embeds | Power BI login |
| REST API + JavaScript SDK | Programmatic control | Flexible |
- For custom applications, use the Power BI JavaScript SDK (
powerbi-client) to embed and interact with reports programmatically. - Power BI Embedded is billed by Azure capacity (SKU A1–A8) or Premium capacity, not per user.
List of Terms
- DAX — Data Analysis Expressions; formula language for measures and calculated columns.
- Power Query / M — ETL language for data transformation before loading into the model.
- Semantic Model — The logical data model (tables, relationships, measures) that reports are built on.
- Measure — A DAX formula that aggregates data dynamically based on report filters.
- Calculated Column — A DAX column computed row-by-row when data loads into the model.
- Import Mode — Default storage mode; data is loaded into in-memory columnar storage (VertiPaq).
- DirectQuery — Power BI sends live SQL queries to the source on every visual interaction.
- Composite Model — A dataset mixing Import and DirectQuery tables.
- Row-Level Security (RLS) — Restricts what data each user can see based on roles and DAX filters.
- Gateway — On-premises data gateway that allows the Service to refresh local data sources.
- Paginated Report — Print-ready, pixel-perfect report format; the successor to SSRS.
- Dataflow — Cloud-based Power Query transformations reusable across multiple datasets.
- VertiPaq — The in-memory columnar engine that powers Import mode performance.
Useful Resources
- Official docs: https://learn.microsoft.com/en-us/power-bi/
- Free learning path (Microsoft Learn): https://learn.microsoft.com/en-us/training/powerplatform/power-bi
- DAX reference guide: https://dax.guide/
- Power Query M reference: https://learn.microsoft.com/en-us/powerquery-m/
- Community forum: https://community.fabric.microsoft.com/t5/Power-BI/ct-p/PBI_English
- Desktop download: https://powerbi.microsoft.com/en-us/downloads/
- Microsoft Certified | Power BI Data Analyst Associate: https://learn.microsoft.com/en-us/credentials/certifications/data-analyst-associate/?practice-assessment-type=certification
Conclusion
Power BI is an excellent choice for organizations already in the Microsoft ecosystem. Start with Power BI Desktop (free download), connect a data source you already know — such as an Excel file or SQL Server table — and build a simple bar chart or table. Once comfortable with the Report view, explore DAX to write your first measure and Power Query to clean up your data. Then publish to the Service and set up a scheduled refresh to keep everything current.